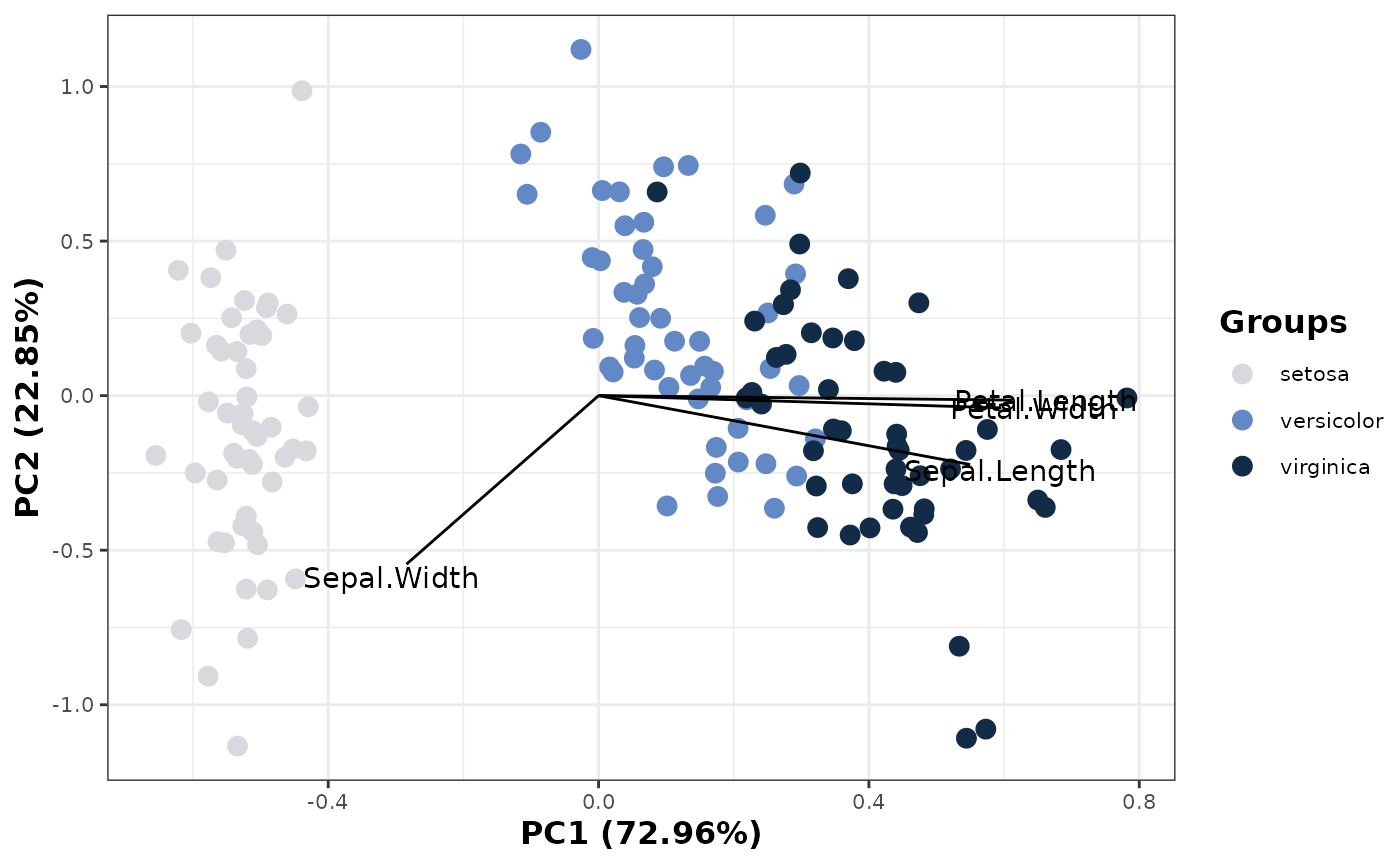
This function uses a group, PCA variables, and a 'scaled' boolean to generate a biplot using 'ggplot2' and 'scico'.
If scaled is set to TRUE, variables will not be scaled. If scaled is set to FALSE, variables will be scaled.
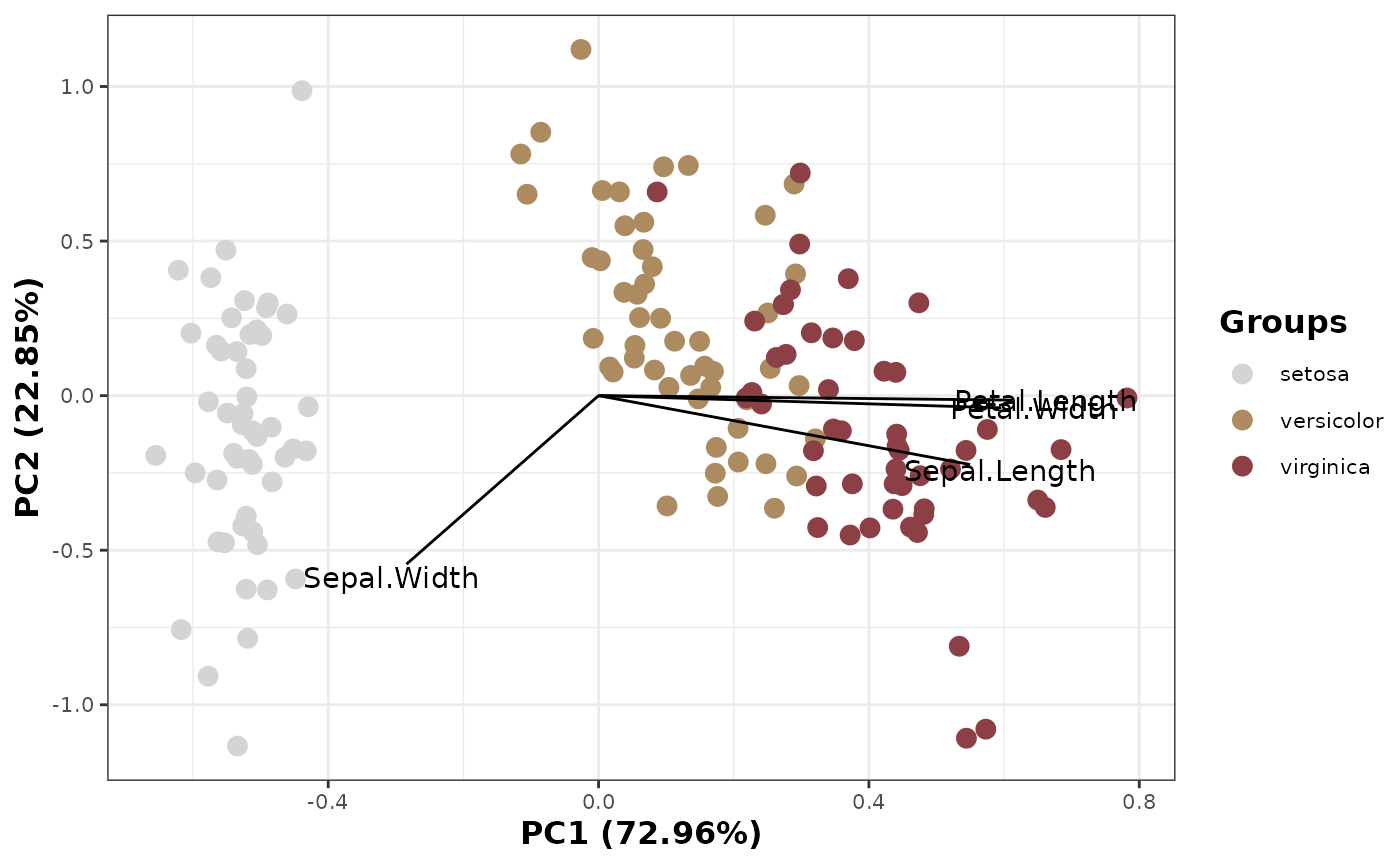
This function uses a group, PCA variables, and a 'scaled' boolean to generate a biplot using 'ggplot2' and 'scico'.
If scaled is set to TRUE, variables will not be scaled. If scaled is set to FALSE, variables will be scaled.