This function extends 'multiCDF_cont' and gets the cumulative distribution functions (CDFs) for selected distributions against a continuous variable. Possible distributions include any combination of "normal", "lognormal", "gamma", "exponential", and "all" (which just uses all of the prior distributions). It then plots this using 'ggplot2' and a 'scico' palette, using var_name for the plot labeling, if specified. If not specified, it will use var instead.
Usage
multicdf_plot(
  var,
  seq_length = 50,
  distributions = "all",
  palette = "oslo",
  var_name = NULL
)Value
A plot showing the CDF of the selected variable against the selected distributions over the selected sequence length
Examples
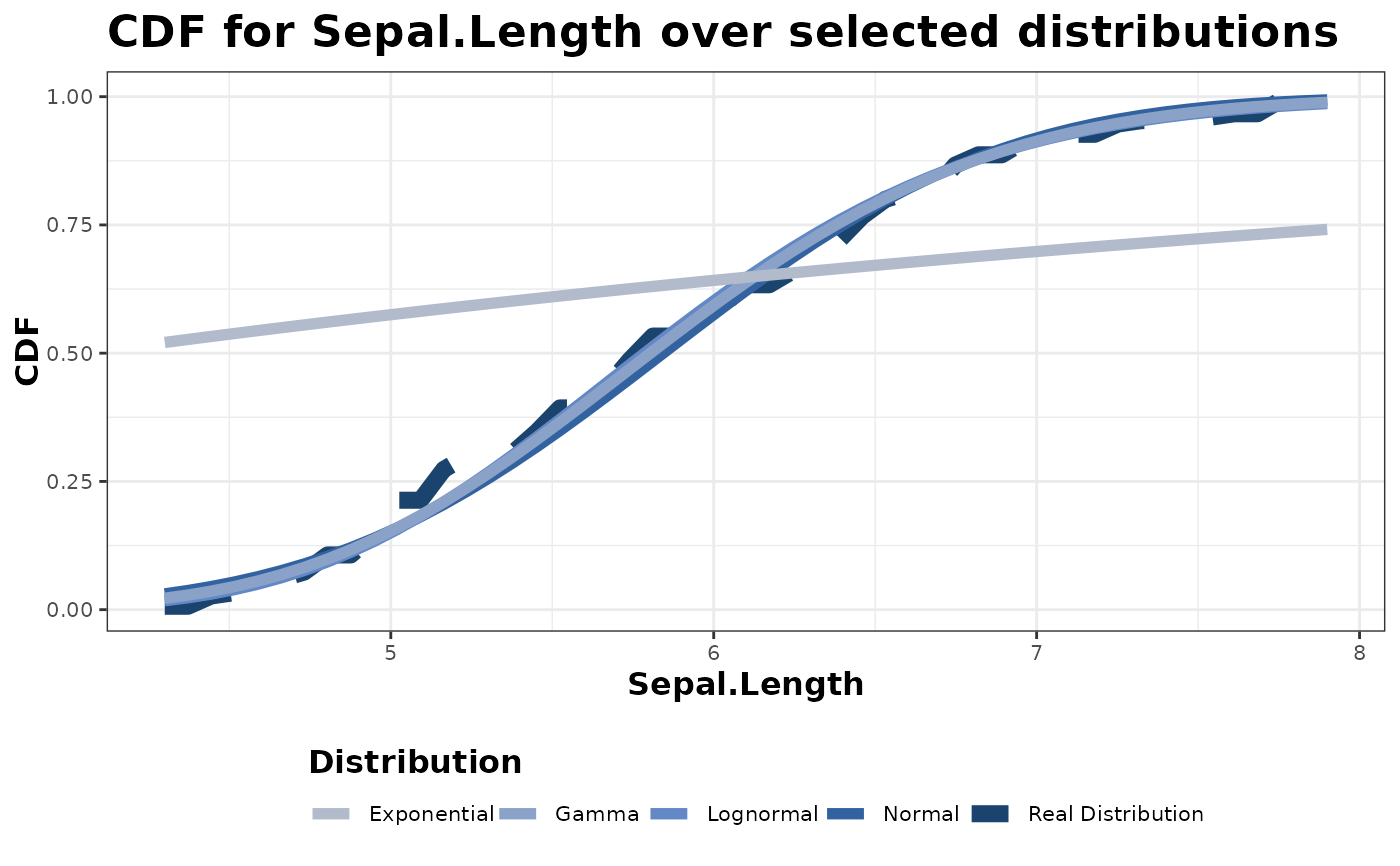
multicdf_plot(iris$Sepal.Length)
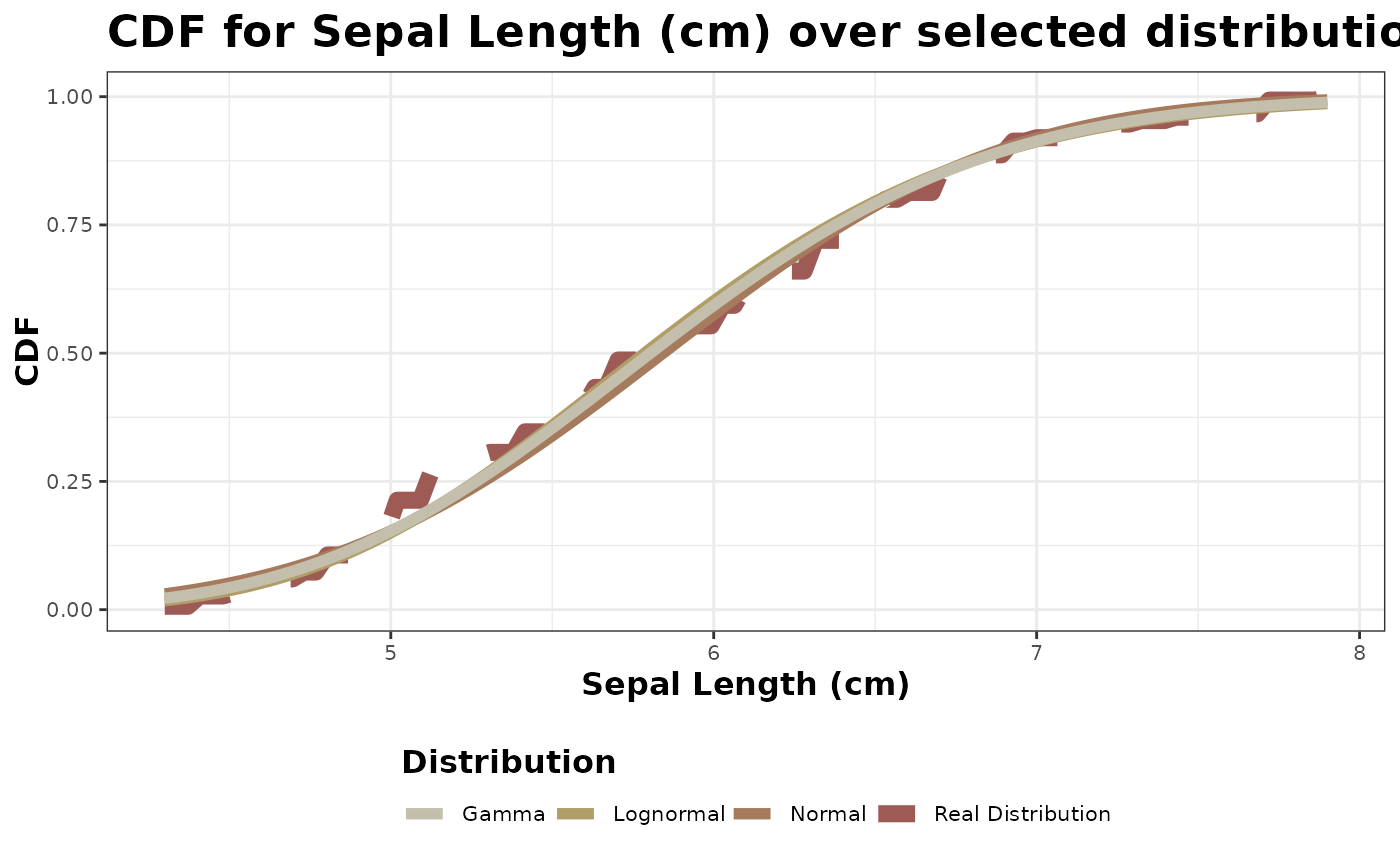
 multicdf_plot(iris$Sepal.Length,
seq_length = 100,
distributions = c("normal", "lognormal", "gamma"),
palette = "bilbao",
var_name = "Sepal Length (cm)"
)
multicdf_plot(iris$Sepal.Length,
seq_length = 100,
distributions = c("normal", "lognormal", "gamma"),
palette = "bilbao",
var_name = "Sepal Length (cm)"
)